Tables
Every table in a Research answer is drawn as a spreadsheet grid: column letters across the top, row numbers down the side, and figures aligned on the right.
- Copy puts the table on your clipboard, so pasting into Excel or Google Sheets fills one cell per value.
- Download .xlsx saves the table as an Excel file named after the heading above it. Amounts and percentages arrive as numbers you can sum and chart.
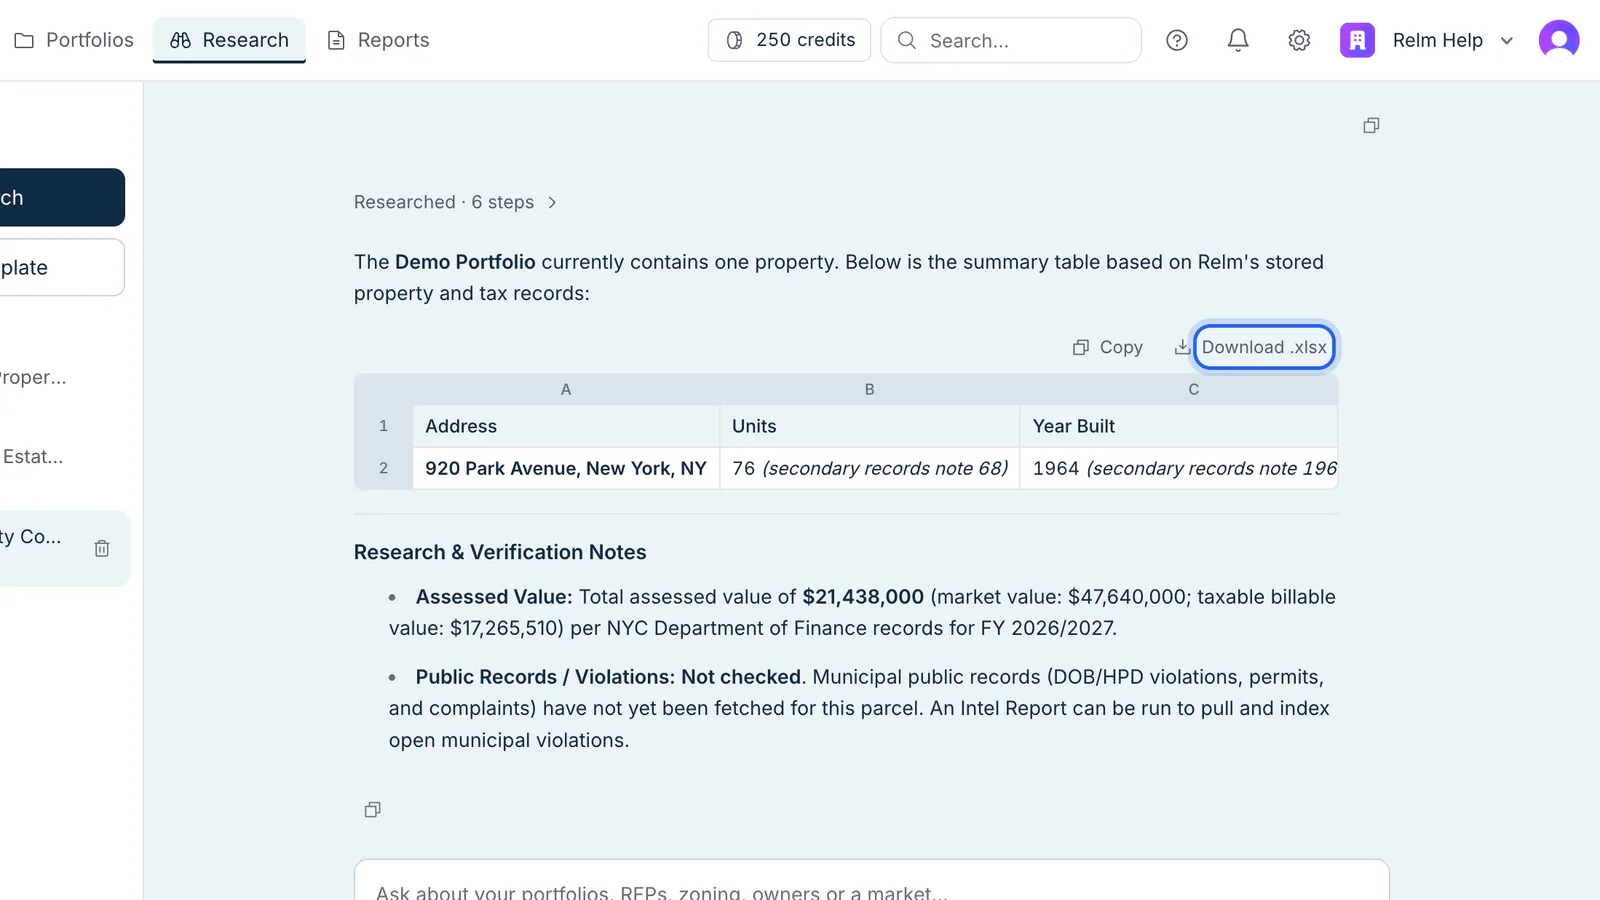
A table wider than the screen scrolls sideways, with the row numbers staying in place.
Reports and workbooks
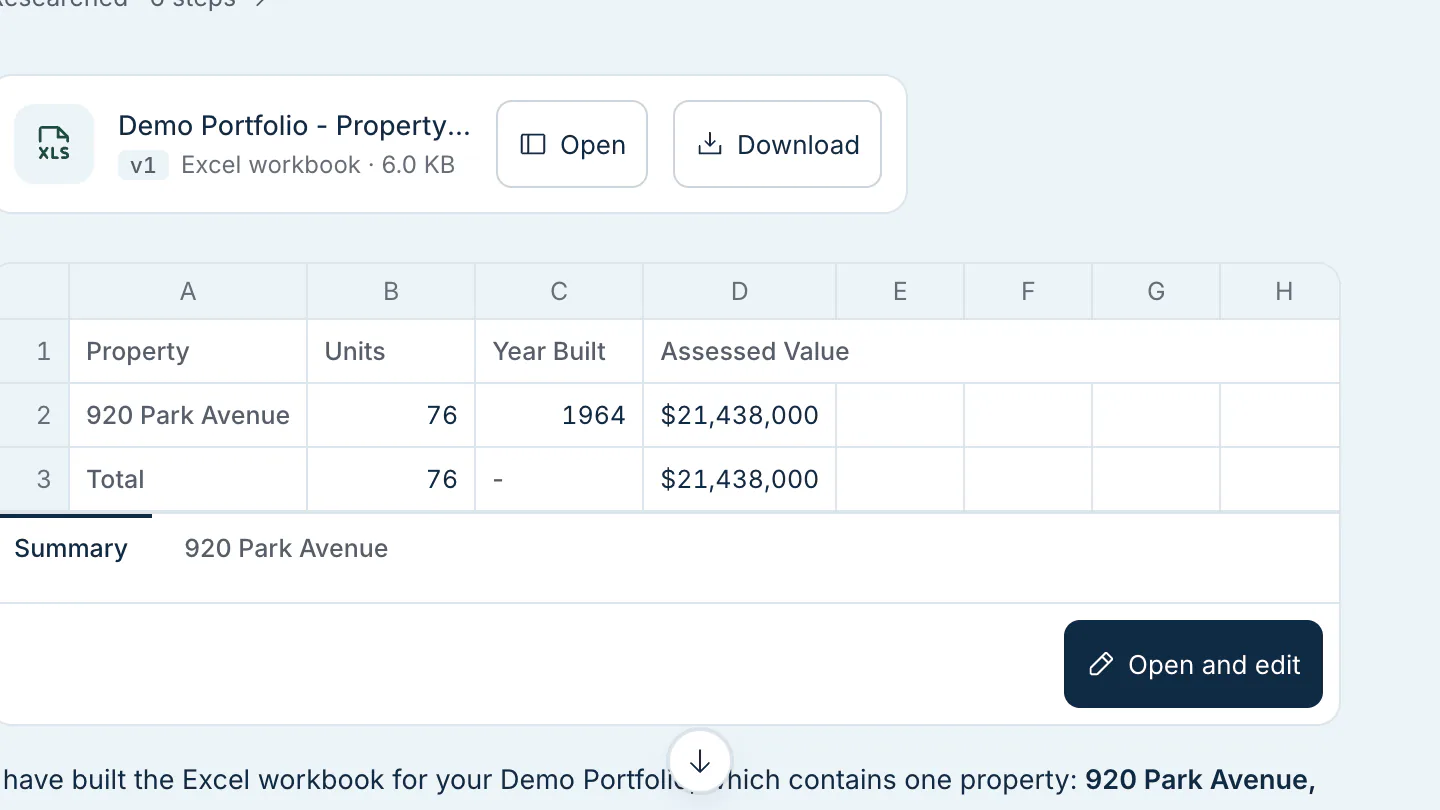
Ask for a memo, a report or a model — "write this up as a one-page memo" or "make an Excel model of this" — and Research builds the file. A card for it appears in the chat.
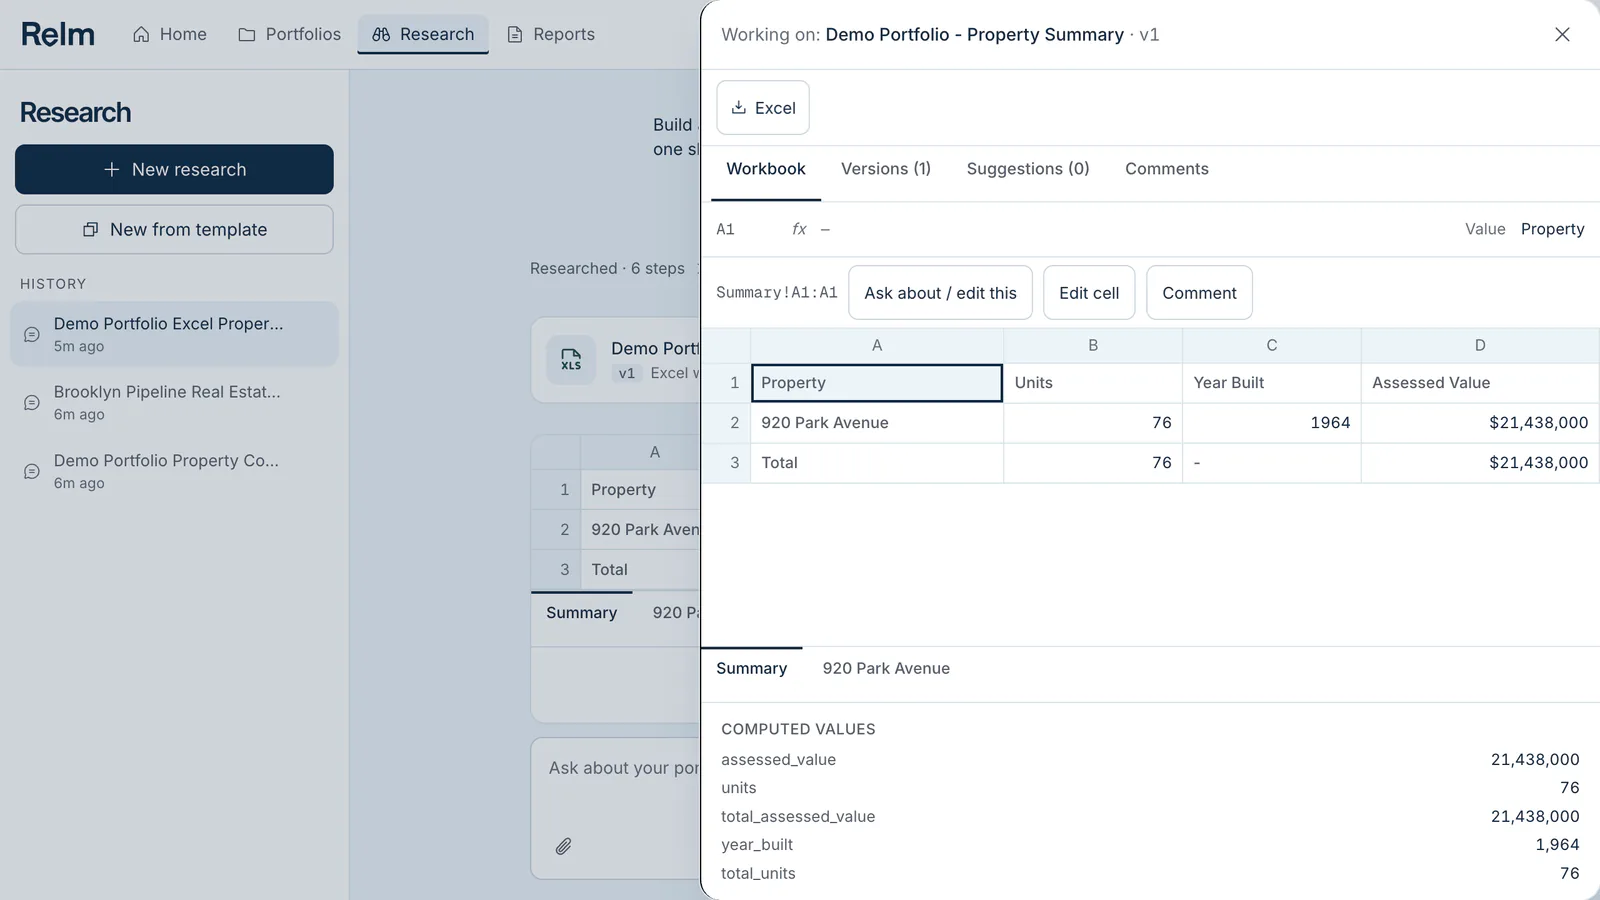
- Open shows the document beside the conversation on a wide screen, and full screen on a phone or tablet.
- A workbook shows a preview of its first rows right in the chat. Click any cell in the open workbook to see its formula and value; inputs are blue. Open and edit lets you change inputs and formulas in place.
- A large model, such as a DCF across a whole portfolio, builds in the background. A card shows what it is doing and how long it has been running.
Versions and downloads
Every version of a document is kept. The panel shows who made each version, when, and what changed, and you can look at an earlier one. Download the Word, Excel or PDF file of the version you are looking at.
Opening a document and previewing a workbook are free; building one uses credits. See Actions and credits in Research.